
Datei:Correlation of gas production and seismicity Groningen Vlek 2019 EnvEarthSci 78(3) 59 fig 3.png

Größe dieser Vorschau: 487 × 600 Pixel. Weitere Auflösungen: 195 × 240 Pixel | 390 × 480 Pixel | 624 × 768 Pixel | 1.030 × 1.268 Pixel
Originaldatei (1.030 × 1.268 Pixel, Dateigröße: 314 KB, MIME-Typ: image/png)
![]()
Diese Datei und die Informationen unter dem roten Trennstrich werden aus dem zentralen Medienarchiv Wikimedia Commons eingebunden.
![]()
Beschreibung
| Beschreibung |
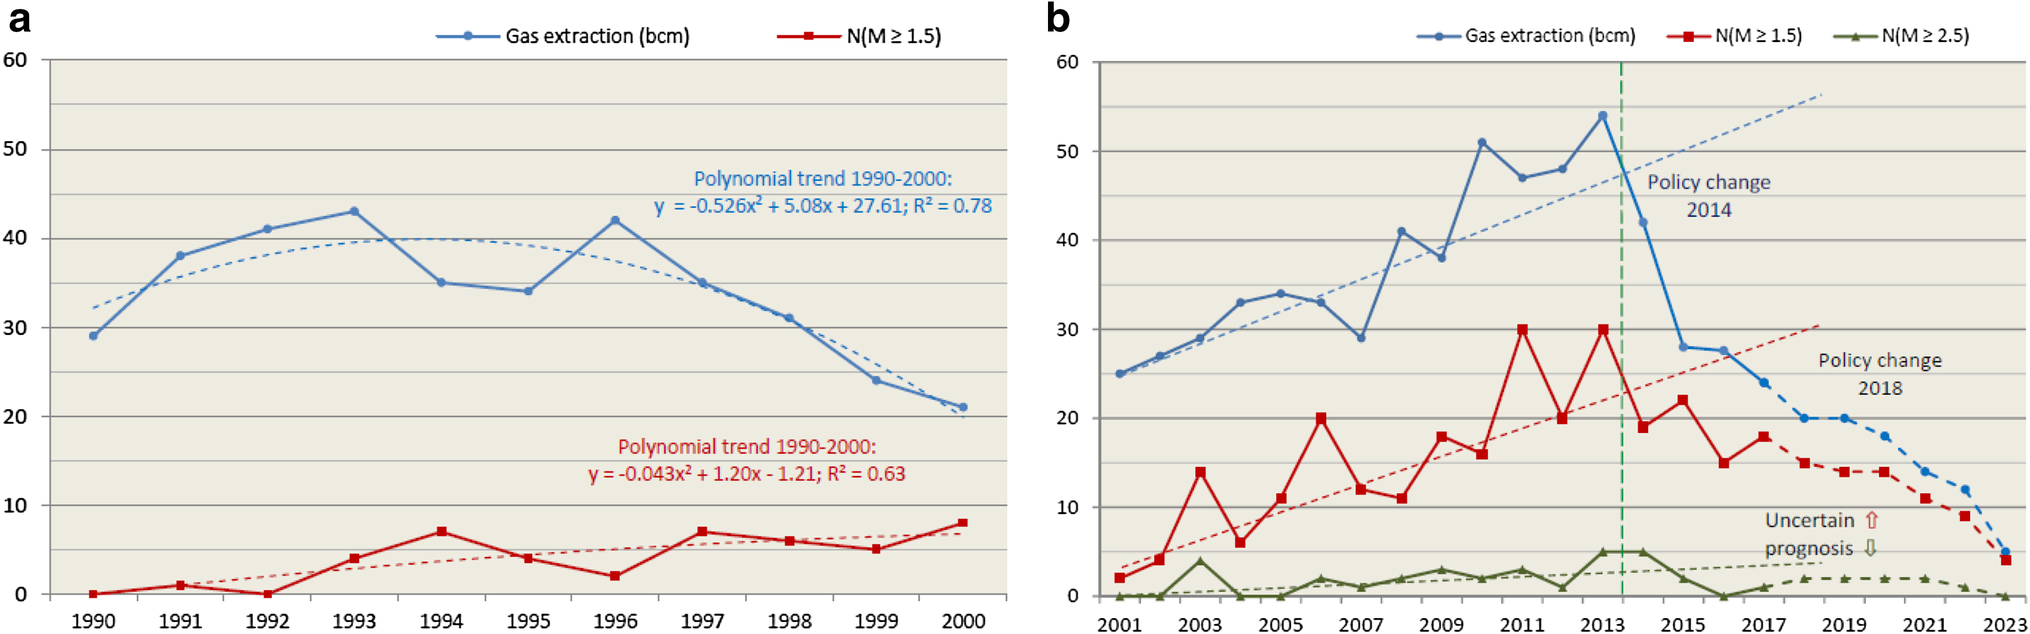
English: Original figure caption: a, b Annual gas extraction (bcm; upper curve) versus annual number (N) of earthquakes with M ≥ 1.5 and ≥ 2.5 (Richter; lower curves). The ordinate (y) fits both annual bcm and earthquake frequency. Basic data from NAM (2016a, 2018) and KNMI (2018). Statistical trends (dashed) over time have been separately fitted for periods 1990–2000 (a) and 2001–2013 (b), excluding 2014–2018.
Deutsch: Induzierte Seismizität im Gasfeld Groningen: Jährliche Erdgasförderung (in bcm = milliarden Kubikmeter; blaue obere Kurven) im Vergleich zur jährlichen Anzahl der Erdbeben (N) mit Magnituden ≥1,5 und ≥2,5 (Richterskala; rote bzw. grüne untere Kurve(n)). Die Zahlen an der Ordinate (y-Achse) gelten jeweils für alle Kurven. Die Rohdaten stammen von NAM (2016a, 2018) und KNMI (2018). Die Steigung der Trendlinien (gestrichelt) ist für die Zeiträume 1990–2000 (a) und 2001–2013 (b) jeweils separat berechnet worden, abzüglich des Zeitraumes von 2014–2018. |
| Datum | (original online publication date) |
| Quelle | Fig. 3 in: Rise and reduction of induced earthquakes in the Groningen gas field, 1991–2018: statistical trends, social impacts, and policy change. Environmental Earth Sciences 78(3):59, doi:10.1007/s12665-019-8051-4 |
| Urheber |
|
| Genehmigung (Weiternutzung dieser Datei) |
The original version of this image was published in Environmental Earth Sciences journal. On the webpage that contains the HTML version of the respective article (link.springer.com, see DOI link above) it is stated that it “is distributed under the terms of the Creative Commons Attribution 4.0 International License (https://creativecommons.org/licenses/by/4.0/)”. |
Lizenz
Diese Datei ist lizenziert unter der Creative-Commons-Lizenz „Namensnennung 4.0 international“.
- Dieses Werk darf von dir
- verbreitet werden – vervielfältigt, verbreitet und öffentlich zugänglich gemacht werden
- neu zusammengestellt werden – abgewandelt und bearbeitet werden
- Zu den folgenden Bedingungen:
- Namensnennung – Du musst angemessene Urheber- und Rechteangaben machen, einen Link zur Lizenz beifügen und angeben, ob Änderungen vorgenommen wurden. Diese Angaben dürfen in jeder angemessenen Art und Weise gemacht werden, allerdings nicht so, dass der Eindruck entsteht, der Lizenzgeber unterstütze gerade dich oder deine Nutzung besonders.
Dateiversionen
Klicke auf einen Zeitpunkt, um diese Version zu laden.
| Version vom | Vorschaubild | Maße | Benutzer | Kommentar | |
|---|---|---|---|---|---|
| aktuell | 17:57, 24. Mai 2019 | | 1.030 × 1.268 (314 KB) | Gretarsson | {{Information |description ={{en|1=Original figure caption: ''a, b Annual gas extraction (bcm; upper curve) versus annual number (N) of earthquakes with M ≥ 1.5 and ≥ 2.5 (Richter; lower curves). The ordinate (y) fits both annual bcm and earthquake frequency. Basic data from NAM (2016a, 2018) and KNMI (2018). Statistical trends (dashed) over time have been separately fitted for periods 1990–2000 (a) and 2001–2013 (b), excluding 2014–2018.''}} {{de|1=Induzierte Seismizität im Gasfeld Groning... |
Dateiverwendung
Die folgende Seite verwendet diese Datei:
Globale Dateiverwendung
Die nachfolgenden anderen Wikis verwenden diese Datei:
- Verwendung auf az.wikipedia.org
- Verwendung auf www.wikidata.org


_59_fig_3.png?uselang=de)
_59_fig_3.png)