
Datei:Globale erwärmung.svg

Größe der PNG-Vorschau dieser SVG-Datei: 480 × 346 Pixel. Weitere aus SVG automatisch erzeugte PNG-Grafiken in verschiedenen Auflösungen: 320 × 231 Pixel | 640 × 461 Pixel | 1.024 × 738 Pixel | 1.280 × 923 Pixel | 2.560 × 1.845 Pixel
Originaldatei (SVG-Datei, Basisgröße: 480 × 346 Pixel, Dateigröße: 136 KB)
![]()
Diese Datei und die Informationen unter dem roten Trennstrich werden aus dem zentralen Medienarchiv Wikimedia Commons eingebunden.
![]()
Beschreibung
| Beschreibung |
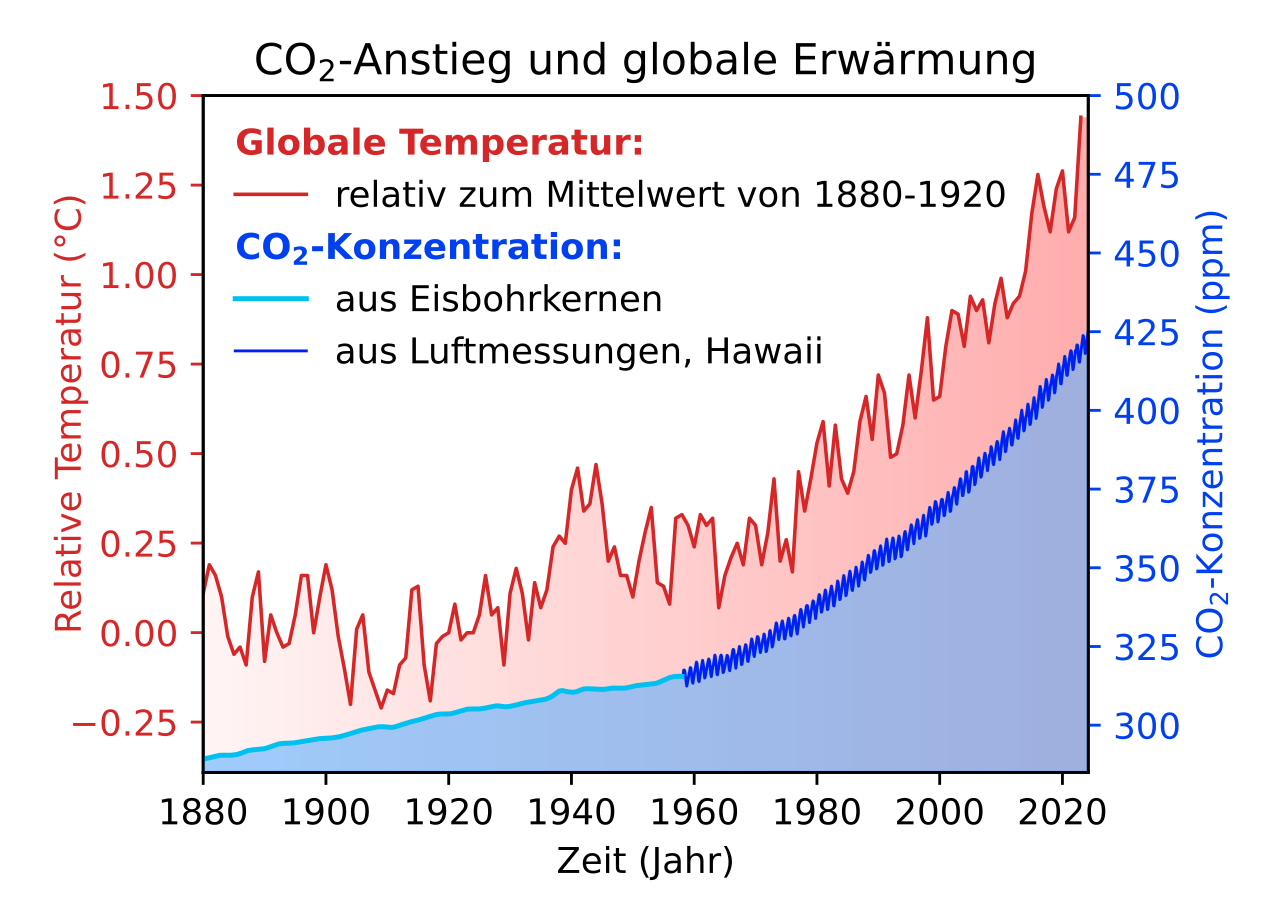
Deutsch: Globale Erwärmung und Anstieg der CO2-Konzentration |
| Datum | |
| Quelle | Eigenes Werk |
| Urheber | Physikinger |
| SVG‑Erstellung | Dieser Plot wurde mit Matplotlib erstellt. |
| Quelltext | Python codeimport numpy, scipy.spatial
import matplotlib.pyplot as plt
import matplotlib
from matplotlib.colors import LinearSegmentedColormap
year_T = {
# https://data.giss.nasa.gov/gistemp/tabledata_v4/GLB.Ts+dSST.txt
# GLOBAL Land-Ocean Temperature Index in 0.01 degrees Celsius base period: 1951-1980
# sources: GHCN-v4 1880-07/2021 + SST: ERSST v5 1880-07/2021
# using elimination of outliers and homogeneity adjustment
# Divide by 100 to get changes in degrees Celsius (deg-C).
# Year J-D (annual mean Temperature Jan to Dec)
1880: -16, 1881: -8, 1882: -11, 1883: -17, 1884: -28,
1885: -33, 1886: -31, 1887: -36, 1888: -17, 1889: -10,
1890: -35, 1891: -22, 1892: -27, 1893: -31, 1894: -30,
1895: -22, 1896: -11, 1897: -11, 1898: -27, 1899: -17,
1900: -8, 1901: -15, 1902: -28, 1903: -37, 1904: -47,
1905: -26, 1906: -22, 1907: -38, 1908: -43, 1909: -48,
1910: -43, 1911: -44, 1912: -36, 1913: -34, 1914: -15,
1915: -14, 1916: -36, 1917: -46, 1918: -30, 1919: -28,
1920: -27, 1921: -19, 1922: -29, 1923: -27, 1924: -27,
1925: -22, 1926: -11, 1927: -22, 1928: -20, 1929: -36,
1930: -16, 1931: -9, 1932: -16, 1933: -29, 1934: -13,
1935: -20, 1936: -15, 1937: -3, 1938: 0, 1939: -2,
1940: 13, 1941: 19, 1942: 7, 1943: 9, 1944: 20,
1945: 9, 1946: -7, 1947: -3, 1948: -11, 1949: -11,
1950: -17, 1951: -7, 1952: 1, 1953: 8, 1954: -13,
1955: -14, 1956: -19, 1957: 5, 1958: 6, 1959: 3,
1960: -3, 1961: 6, 1962: 3, 1963: 5, 1964: -20,
1965: -11, 1966: -6, 1967: -2, 1968: -8, 1969: 5,
1970: 3, 1971: -8, 1972: 1, 1973: 16, 1974: -7,
1975: -1, 1976: -10, 1977: 18, 1978: 7, 1979: 16,
1980: 26, 1981: 32, 1982: 14, 1983: 31, 1984: 16,
1985: 12, 1986: 18, 1987: 32, 1988: 39, 1989: 27,
1990: 45, 1991: 40, 1992: 22, 1993: 23, 1994: 31,
1995: 45, 1996: 33, 1997: 46, 1998: 61, 1999: 38,
2000: 39, 2001: 53, 2002: 63, 2003: 62, 2004: 53,
2005: 67, 2006: 63, 2007: 66, 2008: 54, 2009: 65,
2010: 72, 2011: 61, 2012: 65, 2013: 67, 2014: 74,
2015: 90, 2016: 101, 2017: 92, 2018: 85, 2019: 97,
2020: 102, 2021: 85, 2022: 89, 2023: 117
}
year_Temperature, Temperature = (numpy.array(list(x()), dtype='d') for x in (year_T.keys, year_T.values))
Temperature = Temperature / 100
year1 = 1880
# Keeling curve, monthly data, taken at Mauna Loa, Observatory, Hawaii
#
# C. D. Keeling, et al., Exchanges of atmospheric CO2 and 13CO2 with
# the terrestrial biosphere and oceans from 1978 to 2000.
# I. Global aspects, SIO Reference Series, No. 01-06,
# Scripps Institution of Oceanography, San Diego, 88 pages, 2001.
#
# https://scrippsco2.ucsd.edu/data/atmospheric_co2/mlo.html
# data from https://scrippsco2.ucsd.edu/assets/data/atmospheric/stations/in_situ_co2/monthly/monthly_in_situ_co2_mlo.csv
with open("monthly_in_situ_co2_mlo.csv", 'r') as f:
t, ppm_Keeling = [], []
for line in f:
if not line.startswith('"') and not line.startswith(' '):
data = line.split(',')
val = float(data[8])
if val > 0:
t.append(float(data[3]))
ppm_Keeling.append(val)
year_Keeling, ppm_Keeling = map(numpy.array, (t, ppm_Keeling))
# CO2 concentration from ice core measurements
#
# Rubino et al. 2013, https://agupubs.onlinelibrary.wiley.com/doi/full/10.1002/jgrd.50668
# Colum 1: effective age [AD] for CO2
# Colum 2: CO2 corrected for blank and gravity [ppm]
#
CO2_ice_core = [
[1993.0, 354.31], [1993.0, 353.58], [1991.0, 352.5], [1991.0, 352.33], [1991.0, 351.83],
[1990.0, 351.14], [1990.0, 350.72], [1990.0, 350.57], [1989.0, 349.53], [1989.0, 349.02],
[1988.0, 347.6], [1987.0, 345.44], [1987.0, 345.14], [1987.0, 344.97], [1987.0, 344.51],
[1987.0, 344.25], [1986.0, 344.28], [1986.0, 343.66], [1986.0, 343.64], [1986.0, 342.88],
[1986.0, 342.8], [1985.0, 342.53], [1985.0, 341.57], [1983.0, 339.52], [1983.0, 339.41],
[1979.0, 335.23], [1979.0, 334.47], [1976.0, 332.37], [1996.0, 359.62], [1996.0, 359.67],
[1996.0, 359.65], [1994.0, 357.35], [1994.0, 356.96], [1994.0, 357.02], [1994.0, 357.09],
[1992.0, 353.86], [1992.0, 353.66], [1992.0, 353.65], [1992.0, 353.73], [1989.0, 350.05],
[1989.0, 349.8], [1989.0, 349.78], [1989.0, 349.58], [1983.0, 341.58], [1983.0, 341.16],
[1983.0, 341.42], [1983.0, 341.15], [1971.0, 324.9], [1971.0, 324.88], [1971.0, 325.04],
[1971.0, 324.8], [1957.0, 316.44], [1957.0, 316.29], [1957.0, 316.33], [1957.0, 316.24],
[1938.0, 312.5], [1938.0, 312.58], [1938.0, 312.23], [1938.0, 312.31], [1938.0, 312.07],
[1938.0, 312.28], [1998.0, 361.78], [2001.0, 368.0], [2001.0, 368.04], [1929.0, 305.84],
[1929.0, 305.23], [1929.0, 305.39], [1929.0, 305.37], [1929.0, 305.16], [1929.0, 305.3],
[1962.0, 316.59], [1972.0, 330.35], [1977.0, 335.55], [1977.0, 332.37], [1956.0, 314.46],
[1956.0, 315.54], [1956.0, 316.04], [1969.0, 323.87], [1969.0, 324.09], [1969.0, 320.38],
[1974.0, 331.55], [1950.0, 312.0], [1967.0, 320.49], [1972.0, 328.42], [1965.0, 319.2],
[1965.0, 319.89], [1971.0, 326.31], [1971.0, 326.65], [1970.0, 324.56], [1964.0, 319.12],
[1969.0, 325.54], [1963.0, 319.07], [1969.0, 325.08], [1963.0, 319.78], [1963.0, 317.45],
[1940.0, 309.8], [1963.0, 317.45], [1962.0, 319.14], [1962.0, 317.52], [1938.0, 308.48],
[1967.0, 322.17], [1960.0, 313.09], [1966.0, 320.98], [1959.0, 316.33], [1958.0, 316.1],
[1958.0, 314.57], [1957.0, 315.27], [1929.0, 305.78], [1957.0, 314.24], [1957.0, 314.64],
[1928.0, 305.67], [1955.0, 314.83], [1955.0, 314.6], [1961.0, 318.21], [1954.0, 313.17],
[1954.0, 312.8], [1954.0, 312.75], [1954.0, 311.69], [1959.0, 311.98], [1952.0, 312.18],
[1950.0, 313.66], [1949.0, 309.69], [1948.0, 311.57], [1947.0, 313.21], [1947.0, 312.52],
[1906.0, 299.63], [1946.0, 312.56], [1945.0, 311.28], [1945.0, 310.22], [1902.0, 297.14],
[1944.0, 312.36], [1942.0, 311.62], [1942.0, 312.14], [1942.0, 312.74], [1942.0, 312.05],
[1941.0, 307.74], [1941.0, 311.8], [1947.0, 310.36], [1946.0, 311.97], [1945.0, 311.81],
[1939.0, 311.04], [1939.0, 311.39], [1939.0, 312.36], [1939.0, 308.55], [1945.0, 310.44],
[1893.0, 295.32], [1938.0, 310.66], [1938.0, 312.38], [1937.0, 307.06], [1937.0, 307.76],
[1936.0, 309.52], [1936.0, 309.17], [1942.0, 311.9], [1942.0, 313.78], [1936.0, 307.26],
[1935.0, 306.32], [1934.0, 306.76], [1934.0, 306.63], [1934.0, 307.84], [1884.0, 289.23],
[1940.0, 310.95], [1933.0, 305.94], [1933.0, 308.28], [1932.0, 308.26], [1938.0, 311.94],
[1931.0, 305.72], [1931.0, 305.76], [1929.0, 305.71], [1928.0, 307.62], [1928.0, 308.42],
[1934.0, 309.63], [1868.0, 287.99], [1925.0, 305.32], [1925.0, 304.62], [1923.0, 306.13],
[1923.0, 307.7], [1923.0, 303.14], [1923.0, 307.82], [1923.0, 303.18], [1920.0, 301.88],
[1925.0, 304.72], [1919.0, 304.61], [1918.0, 303.44], [1918.0, 303.67], [1918.0, 304.06],
[1918.0, 304.24], [1851.0, 288.79], [1916.0, 301.92], [1914.0, 301.07], [1914.0, 300.33],
[1847.0, 286.84], [1913.0, 301.3], [1911.0, 299.26], [1911.0, 297.73], [1911.0, 298.11],
[1910.0, 297.87], [1837.0, 284.15], [1909.0, 301.5], [1833.0, 283.82], [1906.0, 297.33],
[1905.0, 299.02], [1904.0, 295.99], [1827.0, 285.91], [1825.0, 281.36], [1902.0, 295.26],
[1902.0, 294.44], [1900.0, 294.22], [1899.0, 297.05], [1899.0, 295.28], [1814.0, 284.43],
[1894.0, 293.81], [1894.0, 293.17], [1893.0, 294.86], [1892.0, 295.17], [1890.0, 290.92],
[1889.0, 292.38], [1889.0, 292.3], [1799.0, 281.23], [1799.0, 284.37], [1887.0, 294.34],
[1796.0, 280.4], [1796.0, 282.3], [1886.0, 288.12], [1794.0, 281.62], [1884.0, 289.76],
[1883.0, 292.46], [1880.0, 287.77], [1780.0, 273.07], [1877.0, 289.33], [1779.0, 280.24],
[1874.0, 291.56], [1873.0, 286.66], [1773.0, 277.86], [1870.0, 286.33], [1870.0, 287.99],
[1868.0, 289.83], [1868.0, 289.24], [1764.0, 276.4], [1867.0, 284.71], [1867.0, 285.4],
[1763.0, 277.16], [1864.0, 286.65], [1863.0, 285.35], [1752.0, 276.46], [1752.0, 278.0],
[1862.0, 287.17], [1749.0, 277.6], [1859.0, 286.63], [1857.0, 283.16], [1741.0, 276.81],
[1855.0, 285.57], [1854.0, 288.05], [1734.0, 278.31], [1851.0, 285.47], [1850.0, 284.0],
[1723.0, 277.01], [1723.0, 278.27], [1846.0, 282.79], [1846.0, 284.45], [1845.0, 283.18],
[1844.0, 283.53]]
year_ice, ppm_ice = numpy.array(CO2_ice_core).T
# Calculate temperature trend
# nPoly = 4
# phi = numpy.array([year_Temperature**i for i in range(nPoly)])
# A = phi @ phi.T
# b = phi @ Temperature
# c = numpy.linalg.solve(A, b)
# yPoly = c @ phi
tRef0, tRef1 = 1880, 1920
TMargin = 0.18
CO2Min, CO2Max = 285, 500
TemperaturReference = numpy.mean(Temperature[(year_Temperature >= tRef0) & (year_Temperature < tRef1)])
TemperatureShifted = Temperature - TemperaturReference
numpy.mean(TemperatureShifted[year_Temperature<1920])
# Ice core data smoothing from scattered data
#
# Covariance model according to Reference:
# C. E. Rasmussen & C. K. I. Williams, Gaussian Processes for Machine Learning, the MIT Press,
# 2006, ISBN 026218253X, 2006 Massachusetts Institute of Technology. www.GaussianProcess.org/gpml
# Section 5.4.3 Examples and Discussion
#
# Here we ignore k2, since the ice core data have
# no seasonal cycle.
def k1(d,p1=66,p2=67): return p1**2*numpy.exp(-d**2/(2*p2**2))
def k2(d,p3=2.4,p4=90,p5=1.3): return p3**2*numpy.exp(-d**2/(2*p4**2) - 2*numpy.sin(numpy.pi*d)**2/p5**2)
def k3(d,p6=0.66,p7=1.2,p8=0.78): return p6*(1+d**2/(2*p8*p7**2))**(-p8)
def k4(d,p9=0.18,p10=1.6): return p9**2*numpy.exp(-d**2/(2*p10**2))
def kNoise(p11=0.19): return p11**2
covFunc = lambda d: k1(d) + k3(d) + k4(d)
def covMat(x1, x2, covFunc, noise=0): # Covariance matrix
cov = covFunc(scipy.spatial.distance_matrix(numpy.atleast_2d(x1).T, numpy.atleast_2d(x2).T))
if not noise==0: cov += numpy.diag(numpy.zeros(len(x1)) + noise)
return cov
x_known = year_ice
y_known = ppm_ice
m = numpy.mean(y_known) # Parameter in Reference 341
nDivideYear = 4
x_unknown = numpy.arange(1880*nDivideYear, year_Keeling[0]*nDivideYear) / nDivideYear
Ckk = covMat(x_known, x_known, covFunc, noise=2) # Noise assumption 2 ppm
Cuu = covMat(x_unknown, x_unknown, covFunc)
CkkInv = numpy.linalg.inv(Ckk)
Cuk = covMat(x_unknown, x_known, covFunc)
covPost = Cuu - numpy.dot(numpy.dot(Cuk,CkkInv),Cuk.T)
y_unknown = numpy.dot(numpy.dot(Cuk,CkkInv),y_known - m) + m
year_reconstructed = x_unknown
ppm_reconstructed = y_unknown
year_Total = numpy.concatenate([year_reconstructed, year_Keeling])
ppm_Total = numpy.concatenate([ppm_reconstructed, ppm_Keeling])
# Plot the figure
class LegendTitle(object):
def __init__(self, text_props=None):
self.text_props = text_props or {}
super(LegendTitle, self).__init__()
def legend_artist(self, legend, orig_handle, fontsize, handlebox):
x0, y0 = handlebox.xdescent, handlebox.ydescent
title = matplotlib.text.Text(x0, y0, orig_handle, **self.text_props)
handlebox.add_artist(title)
return title
fig = plt.figure(figsize=(5.0,3.6))
TMin = numpy.min(TemperatureShifted) - TMargin
plt.title('CO${}_2$-Anstieg und globale Erwärmung')
axTemp = plt.gca()
axTemp.tick_params(axis='y', colors='C3')
axCO2 = plt.gca().twinx()
axCO2.tick_params(axis='y', colors='#0040F0')
polygon = axTemp.fill_between(list(year_Temperature) + [year_Total[-1]],
TMin, list(TemperatureShifted)+[TemperatureShifted[-1]], color='none')
p1, = axTemp.plot(year_Temperature, TemperatureShifted, 'C3-', linewidth=1,
markersize=3, label=f"relativ zum Mittelwert von {tRef0}-"f"{tRef1}")
axCO2.fill_between(year_Total, CO2Min, ppm_Total, color='#60B0FF', alpha=0.6)
p2, = axCO2.plot(year_Keeling, ppm_Keeling, '-', color='#0020F0', linewidth=0.8,
label='aus Luftmessungen, Hawaii')
p3, = axCO2.plot(year_reconstructed, ppm_reconstructed, '-', color='#00C0F0',
linewidth=1.4, label='aus Eisbohrkernen')
cm = LinearSegmentedColormap.from_list("Custom", [(1, 0.96, 0.96),
(1, 0.68, 0.68)], N=256//4)
verts = numpy.vstack([p.vertices for p in polygon.get_paths()])
gradient = axTemp.imshow(numpy.linspace(0, 1, 256//4)[None,:],
cmap=cm, aspect='auto', extent=[verts[:, 0].min(), verts[:, 0].max(),
verts[:, 1].min(), verts[:, 1].max()])
gradient.set_clip_path(polygon.get_paths()[0], transform=axTemp.transData)
axTemp.set_xlabel('Zeit (Jahr)')
axTemp.set_ylabel('Relative Temperatur (°C)', color='C3')
axCO2.set_ylabel('CO${}_2$-Konzentration (ppm)', color='#0040F0')
axTemp.yaxis.set_label_coords(-0.13, 0.53)
axTemp.set_ylim(None,1.5)
axTemp.set_ylim(TMin,None)
axCO2.set_ylim(CO2Min,CO2Max)
plt.xlim(year_Total[0], year_Total[-1])
labels = [i.get_label() if i else i for i in ['',p1,'',p3,p2]]
font = {'color':"C3", 'weight':'bold'}
legend = axTemp.legend(['Globale Temperatur:', p1,
'CO${}_\\mathregular{2}$-Konzentration:', p3, p2],
labels, frameon=False, handler_map={str: LegendTitle(font)})
legend.legend_handles[2].set_color('#0040F0')
plt.tight_layout()
#plt.show()
plt.savefig('Globale_erwärmung.svg')
|
Lizenz
Ich, der Urheber dieses Werkes, veröffentliche es unter der folgenden Lizenz:
| Diese Datei wird unter der Creative-Commons-Lizenz „CC0 1.0 Verzicht auf das Copyright“ zur Verfügung gestellt. | |
| Die Person, die das Werk mit diesem Dokument verbunden hat, übergibt dieses weltweit der Gemeinfreiheit, indem sie alle Urheberrechte und damit verbundenen weiteren Rechte – im Rahmen der jeweils geltenden gesetzlichen Bestimmungen – aufgibt. Das Werk kann – selbst für kommerzielle Zwecke – kopiert, modifiziert und weiterverteilt werden, ohne hierfür um Erlaubnis bitten zu müssen.
|
Dateiversionen
Klicke auf einen Zeitpunkt, um diese Version zu laden.
| Version vom | Vorschaubild | Maße | Benutzer | Kommentar | |
|---|---|---|---|---|---|
| aktuell | 12:54, 22. Jun. 2024 | | 480 × 346 (136 KB) | Physikinger | Luftmessungen |
| 23:16, 21. Jun. 2024 |  | 480 × 346 (136 KB) | Physikinger | Improved legend, x-label | |
| 22:04, 21. Jun. 2024 |  | 480 × 346 (129 KB) | Physikinger | Reverted to version as of 08:03, 21 June 2024 (UTC) | |
| 22:02, 21. Jun. 2024 |  | 480 × 346 (128 KB) | Physikinger | x-label | |
| 10:03, 21. Jun. 2024 |  | 480 × 346 (129 KB) | Physikinger | Legend, noise assumption | |
| 00:25, 21. Jun. 2024 |  | 480 × 346 (127 KB) | Physikinger | With ice core data | |
| 00:52, 18. Jun. 2024 |  | 480 × 346 (241 KB) | Physikinger | Uploaded own work with UploadWizard |
Dateiverwendung
Die folgende Seite verwendet diese Datei:


